Tutorial
In this tutorial, we run tests and visualize the coverage results for algorithms, a project with pythonic implementations of data structures and algorithms. This project has fast and self-contained tests that are easy to run and interpret.
Get the project
Clone the project, initialize virtual environment, and install the dependencies:
git clone git@github.com:keon/algorithms.git
cd algorithms
python -m venv env
source env/bin/activate
pip install -e .
pip install pytest coverage
Run the tests
Run tests with pytest and coverage:
coverage run -m pytest ./tests
As a result, you should have all your tests passed, and a new file .coverage appears in the current directory. Export the coverage statistics to the XML format:
coverage xml
This command creates a new file coverage.xml
Visualize your coverage results
Install coverage-plot:
pip install coverage-plot
Visualize your results:
coverage-plot coverage.xml
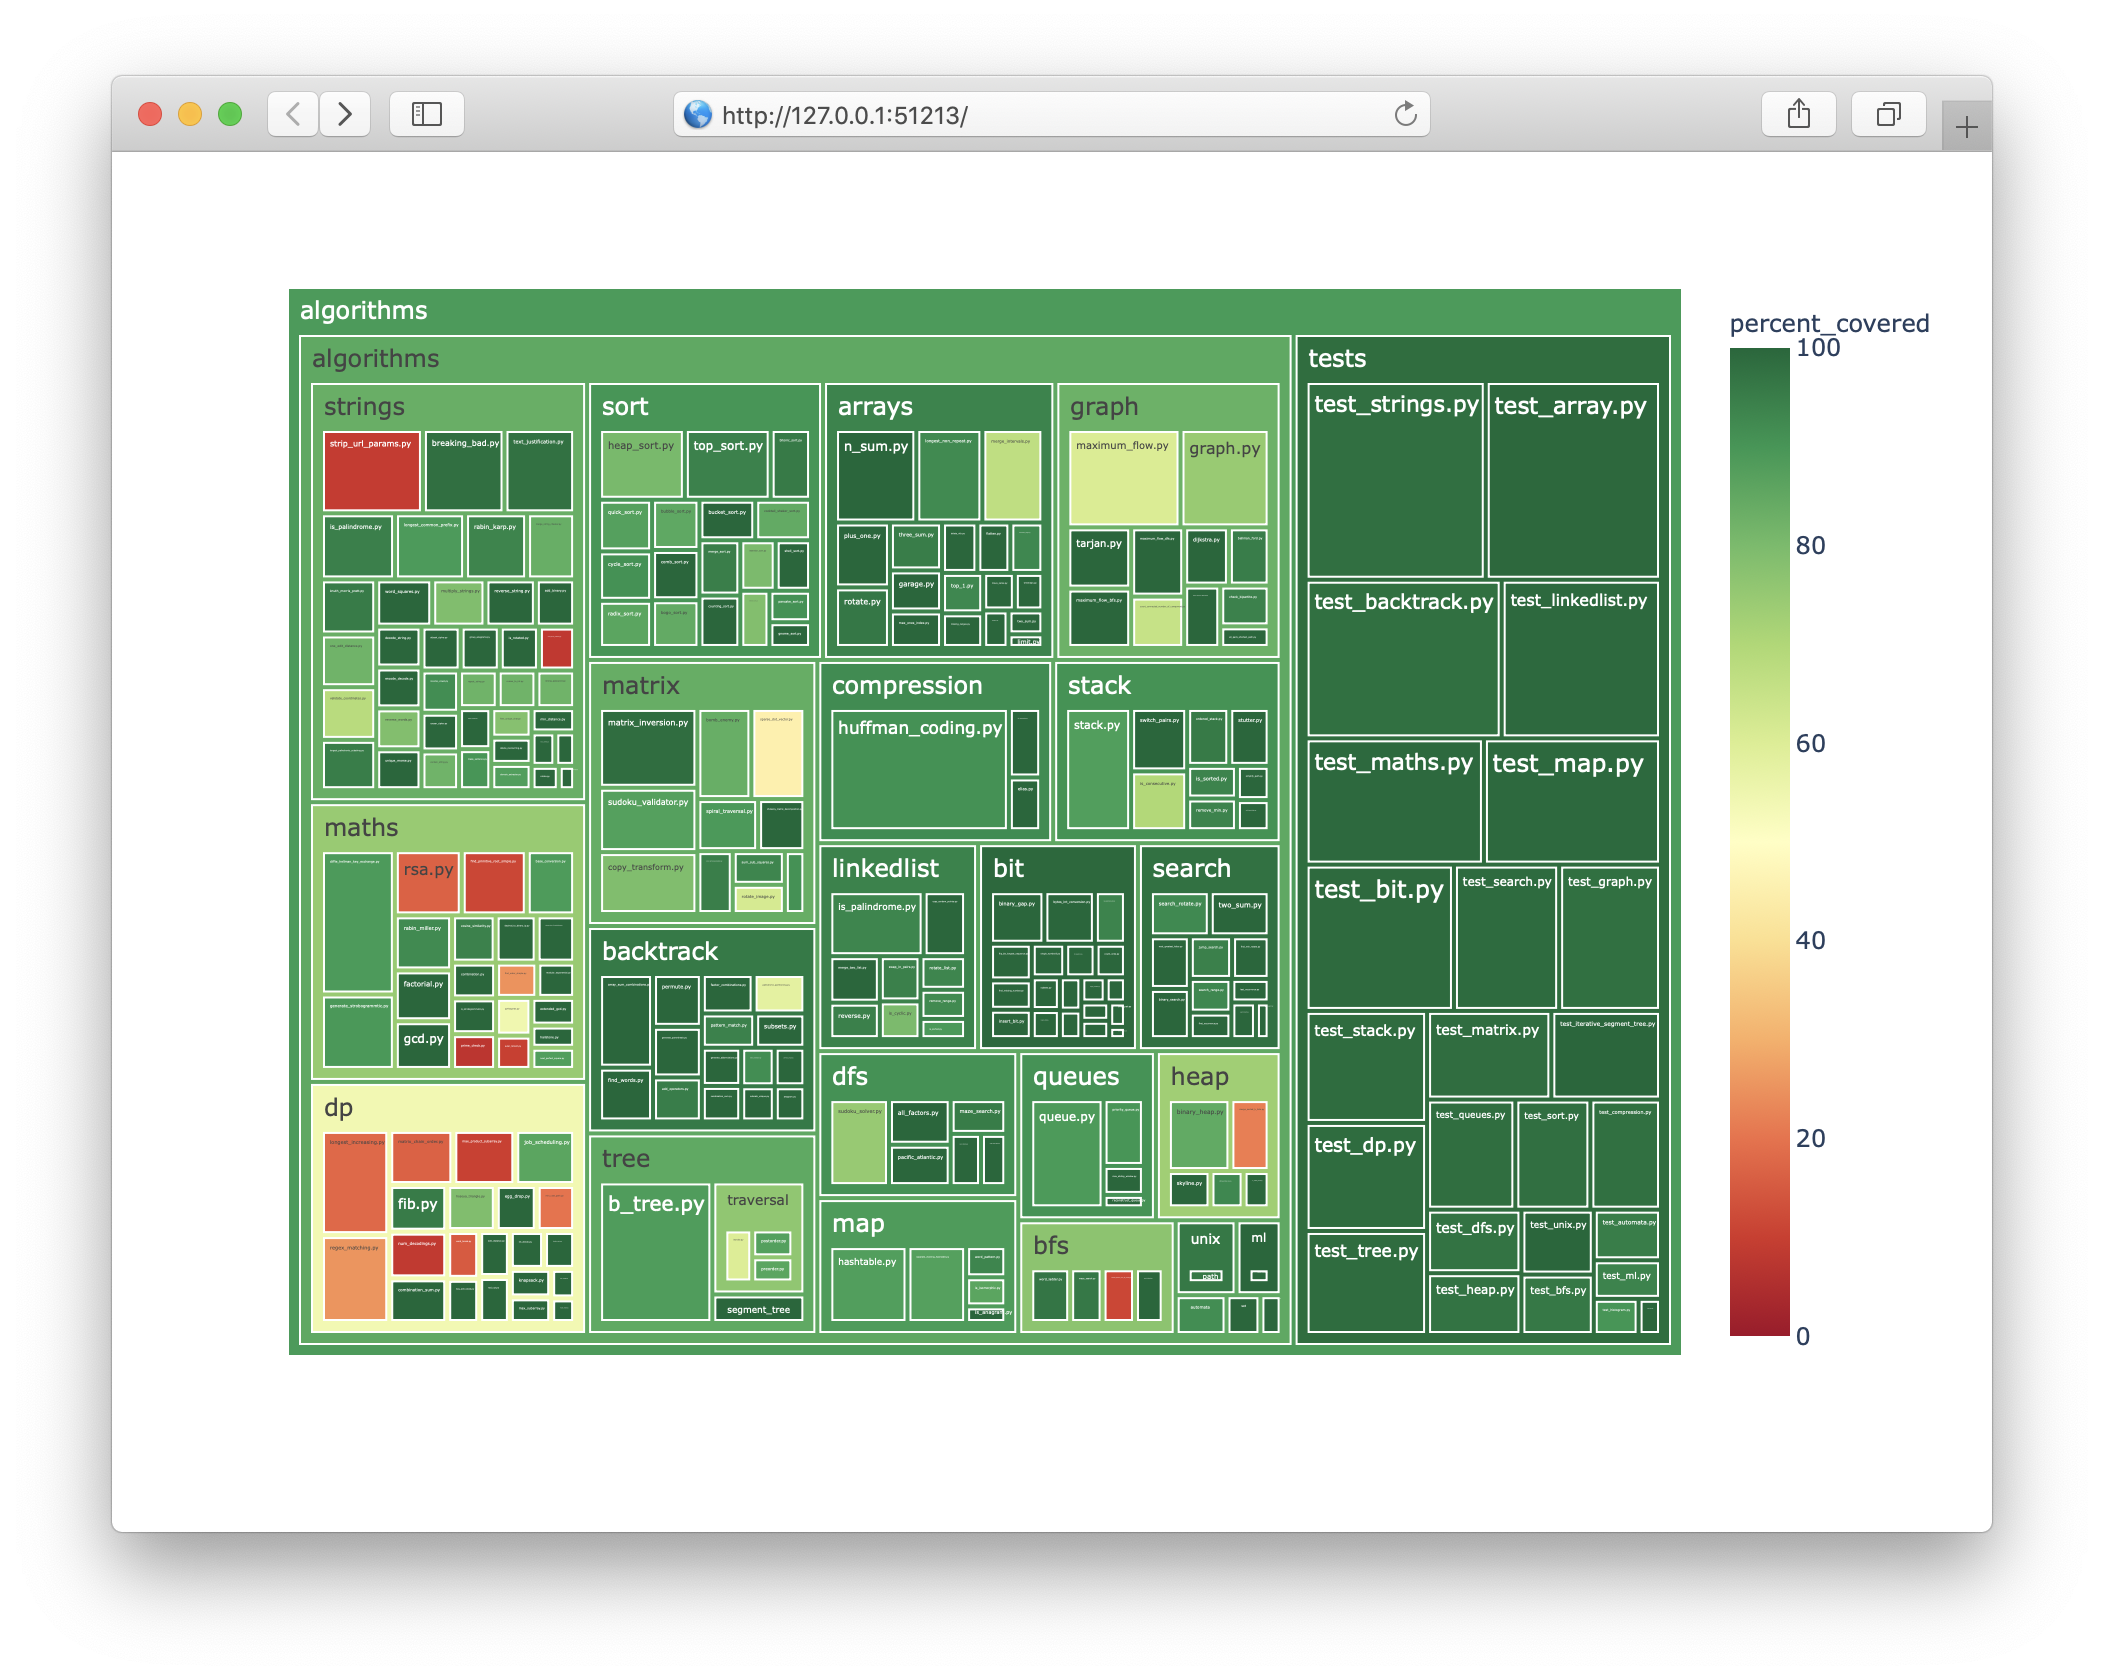
The script opens your browser with a report that would look like this. The format is called Treemap.
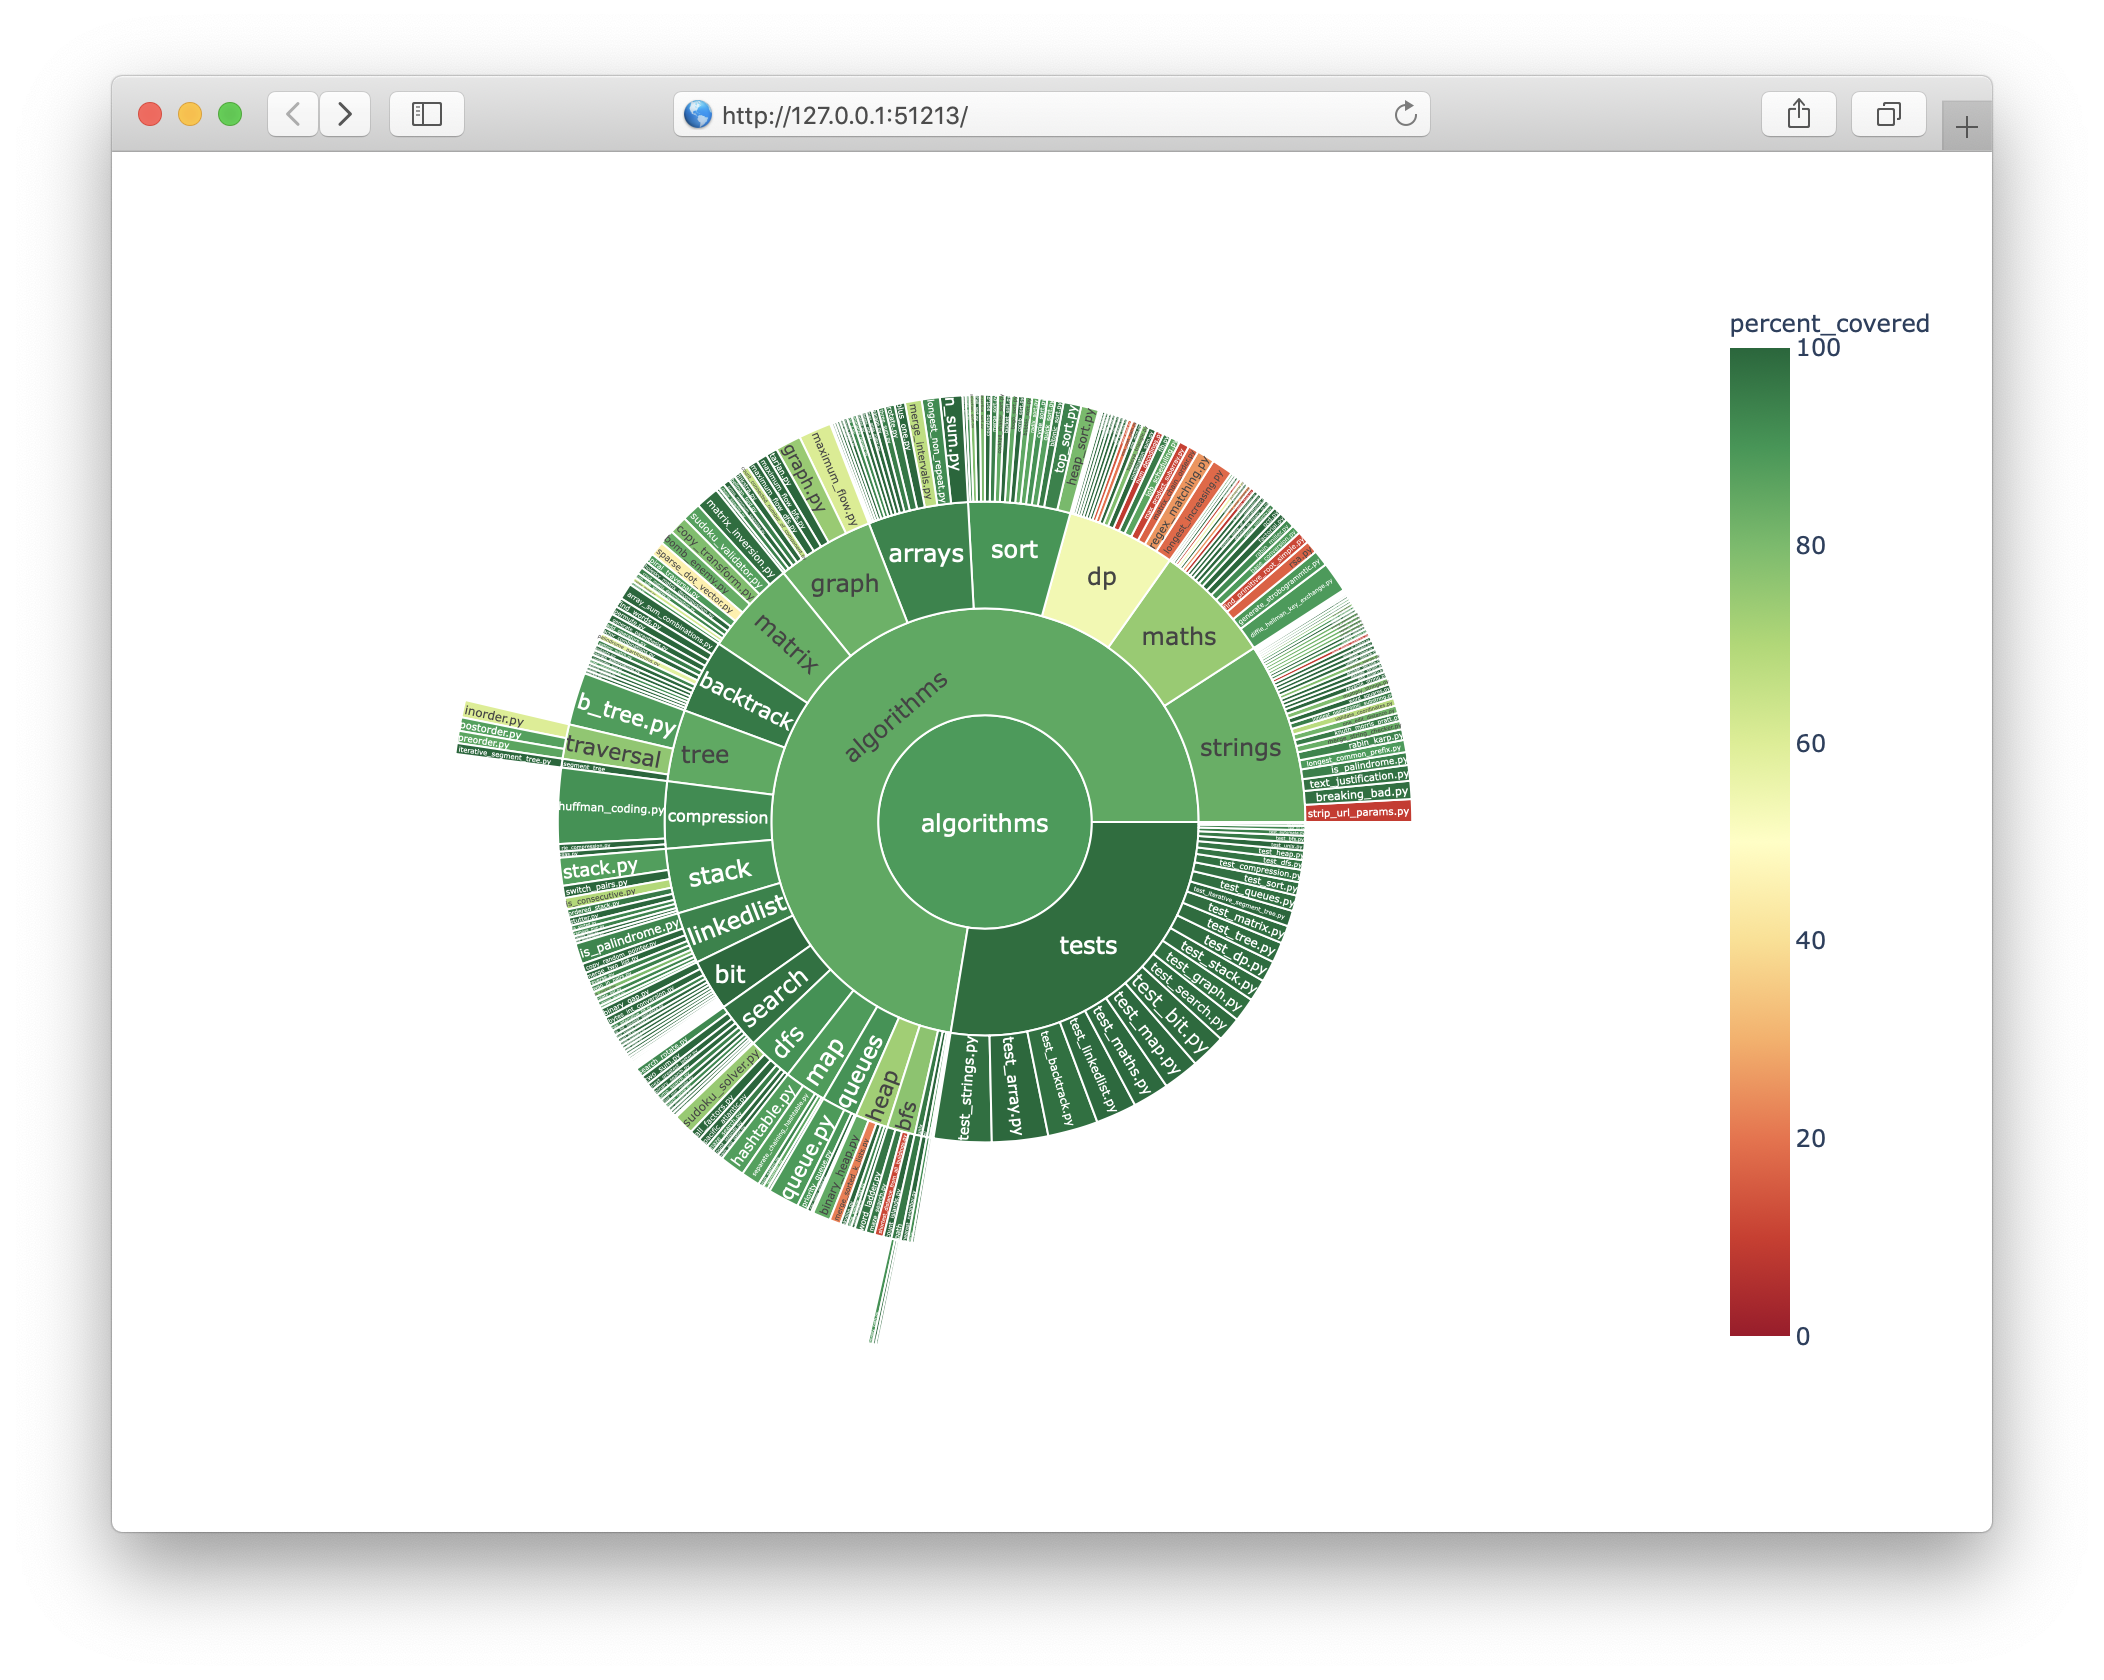
You can choose the Sunburst visualization to get a different representation of the same result:
coverage-plot --plot-type=sunburst coverage.xml